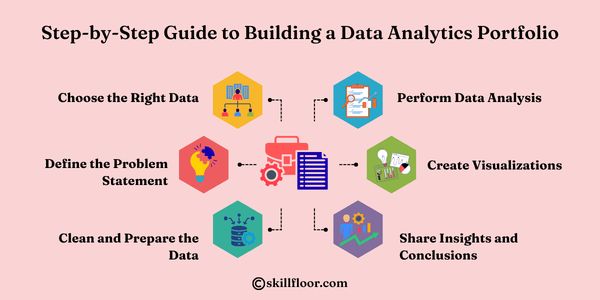
Why a Data Analytics Portfolio Matters
Completing courses and collecting certificates can help you learn, but employers also want to understand what you can actually do with data.
A well-structured portfolio gives you an opportunity to demonstrate your ability to clean data, analyze information, build dashboards, and communicate business insights.
What Should a Data Analytics Portfolio Include?
1. Excel Project
Create a practical Excel project involving data cleaning, formulas, Pivot Tables, charts, and a management-ready report.
2. SQL Project
Build a project where you use SQL queries to retrieve, filter, aggregate, and analyze business data.
3. Power BI Dashboard
Create an interactive dashboard based on a realistic business scenario such as sales, finance, HR, marketing, or operations.
4. Python Data Analysis Project
Use Python and Pandas to clean and analyze a dataset. Explain the questions you wanted to answer and the insights you discovered.
Focus on Business Problems
A strong project is not simply a collection of charts. Start with a business problem.
For example, instead of saying "I created a sales dashboard," explain what the dashboard helps a business understand: revenue trends, top-performing products, regional performance, customer behavior, or target achievement.
Document Every Project
Each portfolio project should clearly explain the objective, dataset, tools used, methodology, key insights, and final outcome.
Quality Over Quantity
You do not need twenty projects. Three to five strong, well-documented projects can demonstrate your skills much better than a large collection of incomplete dashboards.
Keep Improving
Analytics tools continue to evolve. Keep learning Excel, SQL, Power BI, Python, AI tools, and modern data workflows based on the type of role you want to pursue.
Final Thoughts
Your portfolio should answer one simple question for a potential employer: Can this person use data to solve practical problems?
Build projects that make the answer clear.